



Digital advertising ROI: how to calculate it before you launch
Digital advertising ROI measures the profit your campaigns return relative to what you spend. The formula is straightforward: subtract ad spend from revenue generated, divide by ad spend, and multiply by 100. The difficulty is estimating that revenue before any money leaves your account. Most advertisers skip this pre-launch math entirely and discover margin problems only after the budget is gone. Running the numbers first tells you whether a channel can be profitable at current market prices and where the unit economics break down.
This guide covers the pre-launch calculation for the two most common paid channels: Google Search Ads and Facebook/Instagram Ads.
How do you calculate ROI for digital advertising?
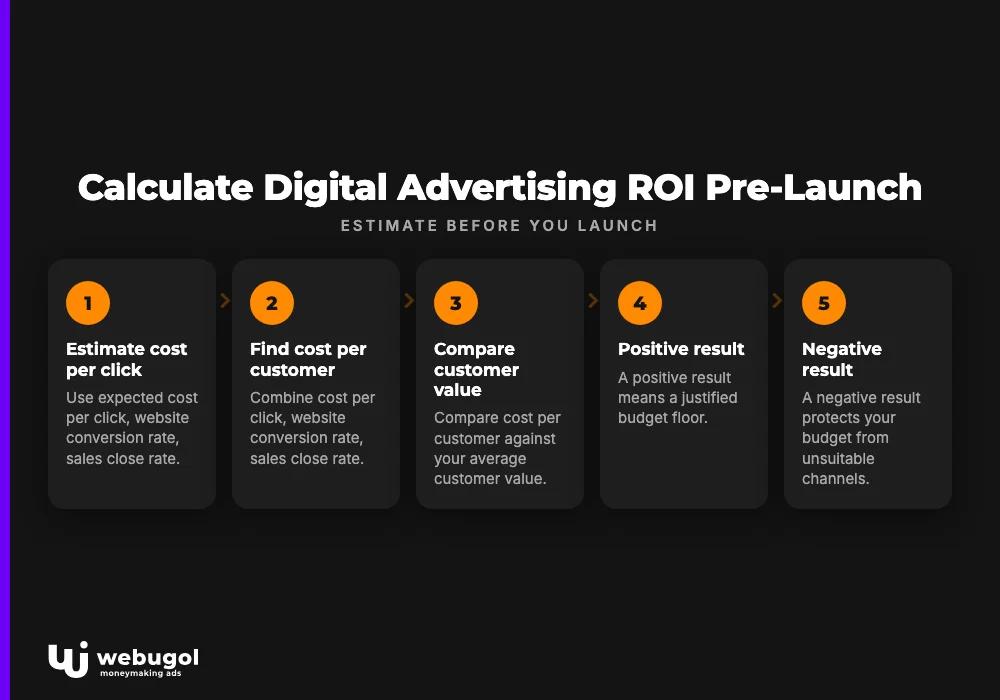
Digital advertising ROI depends on three inputs you can estimate before launching: expected cost per click, website conversion rate, and sales close rate. Combine these to find cost per customer, then compare that number against your average customer value. If the result is positive, you have a justified budget floor. If it is not, you have protected your budget from a channel that cannot support your margins.
The cost per conversion formula is:
Cost per conversion = Average cost per click x (1 / Website conversion rate)
To project digital advertising ROI before launch:
Projected ROI (%) = ((Customer value - Cost per customer) / Cost per customer) x 100
Google Search and Facebook/Instagram require different planning approaches because they price differently. Google charges per click on keywords with active purchase intent. Facebook charges for impressions delivered to defined audience segments, with clicks estimated from the predicted CTR for those audiences. That pricing difference produces different conversion rate benchmarks and a different sequence of calculations for each channel.
| Metric | Google Search Ads | Facebook/Instagram Ads |
|---|---|---|
| Pricing model | Pay per click (CPC) | Pay per impression (CPM) |
| Typical website conversion rate | 1 in 12 to 1 in 20 | 1 in 30 to 1 in 50 |
| Key cost input | Average keyword bid | Audience CPM and estimated CTR |
| Primary planning tool | Google Keywords Planner | Facebook Audience Insights |
| User intent at ad exposure | High: active search | Low to medium: passive browse |
Calculating Google Ads profitability step by step
Build your semantic core and filter it
Google Ads profitability starts with keyword research. Open Google Keywords Planner and pull every keyword relevant to your business, with monthly search volume, competition level, and bid ranges for each term. The Planner returns a low-range and high-range bid estimate per keyword. Average the two to get a working bid estimate.
Before any calculation, remove keywords that will not convert. Informational queries (how-to, what-is, definitions), branded competitor names, and navigational searches generate clicks that rarely become leads for service businesses. A cleaned list tied to buying-intent queries produces a more accurate marketing campaign profitability forecast. Starting the calculation with the full uncleaned list makes projected cost per lead appear lower than it actually will be.
For a step-by-step approach to structuring keyword research for paid search, see how to use the Google Ads keywords tool for your campaigns.
Apply the cost per conversion formula for Google Ads
With a filtered list and average bids in hand, apply an industry website conversion rate. For service businesses, a working range is 1 conversion per 12 to 20 clicks, roughly 5% to 8%. If your analytics already shows conversion data for an existing landing page, use that figure. If not, use the midpoint of the industry range as a starting estimate and refine once the campaign collects data.
Example calculation:
- Average keyword bid: $5.00
- Website conversion rate: 1 in 15 (approximately 6.7%)
- Cost per lead: $5.00 x 15 = $75.00
Apply your sales close rate to find cost per customer:
- Sales conversion rate: 1 in 3
- Cost per customer: $75.00 x 3 = $225.00
If a customer generates $1,000 in margin, the channel delivers a positive digital advertising ROI. If the margin per customer is $200, the unit economics do not support that cost per customer at current bid prices. The response is not to launch anyway. It is to determine whether lower-competition keywords reduce the average bid, whether the landing page can improve conversion rate, or whether this channel fits the business's margin structure at all.
Stress-test your projections across the bid range
Keyword bids shift with seasonal demand and competitor activity. Running the cost per conversion formula at only the average bid gives a single-point estimate. Run it at the Planner's low-range and high-range bids as well. This produces a cost-per-customer range from best case to worst case.
If Google Ads profitability holds only at the low-range bid, entering that keyword auction carries more risk than the average number suggests. Active auctions tend to price closer to the upper range when competition is strong. A campaign that returns a positive digital advertising ROI at the average bid and a marginal one at the high-range bid is a more honest picture of what to expect in a live market.
What is a good ROI for Google Ads?
A positive digital advertising ROI is the starting threshold: revenue must exceed total campaign cost. Beyond that baseline, whether the return is acceptable depends on margin structure and customer lifetime value.
A campaign that breaks even on first-time customer acquisition may be worth running if repeat purchases are common. Lifetime value raises the return per acquired customer above what the initial transaction shows. The opposite also holds: a campaign with a high percentage ROI on paper may not be viable in practice if it reaches volume limits quickly or requires more operational capacity than is available.
The pre-launch calculation identifies whether to enter the channel at all. If the math shows a negative margin at average bids before the campaign runs, no bidding strategy or ad creative will resolve the underlying problem. The fix belongs in the offer, the price point, or the keyword strategy, not in campaign management.
How do you calculate cost per lead for Facebook ads?
Facebook and Instagram ads require a different setup because the platform does not charge per click. You pay for impressions, and Facebook estimates click volume based on the average CTR it predicts for your chosen audience segments and creative format. Actual click volume can differ meaningfully from that estimate depending on how the creative performs.
Start by defining your target audience segments. Facebook's planning tools return estimated market volume for each audience, daily reach at your target budget, estimated cost per click, and projected click volume within that budget. These inputs feed directly into the Facebook and Instagram ads cost per lead calculation.
Facebook ads cost per lead = Estimated cost per click x (1 / Facebook landing page conversion rate)
The conversion rate in this formula differs from the Google benchmark because the intent level of the traffic differs. Facebook reaches people who were not actively searching for your product or service, which affects behavior after the click.
What is the average Facebook Ads conversion rate?
For Facebook and Instagram, a working range is 1 conversion per 30 to 50 clicks, roughly 2% to 3.3%. This is lower than Google Search benchmarks because the user was not in a buying mindset when the ad appeared. A Google user typed in a specific query; a Facebook user was scrolling through unrelated content when the ad interrupted their session.
Ad creative has a direct effect on facebook ads conversion rate in a way it does not on Google. Because you pay for impressions regardless of whether anyone clicks, the difference between 10 clicks and 100 clicks from 1,000 impressions comes from how well the creative drives CTR. Campaigns that open with video identifying a specific problem in the first few seconds and presenting a concrete outcome tend to produce higher CTR from the same audience at the same CPM. This is not a secondary creative concern; it determines your cost per lead directly.
For context on how paid social fits into broader marketing strategy, see the role of social media in healthcare marketing: trends and insights.
Using an ad spend calculator to set your budget
How much should you spend on digital advertising?
Work backward from your customer target, not forward from an arbitrary budget number. An ad spend calculator follows three steps:
- Set a monthly customer acquisition target.
- Divide by your sales close rate to find the number of leads required.
- Multiply required leads by cost per lead to find the minimum viable monthly spend.
Example using the numbers above:
- Customer target: 10 per month
- Sales close rate: 1 in 3, so 30 leads required
- Cost per lead: $75
- Minimum monthly ad spend: 30 x $75 = $2,250
A budget below this floor means the campaign cannot reach the customer target even when every conversion benchmark holds exactly as projected. A budget above it creates room to test audience segments, creative variants, and bidding approaches, which is how cost per lead decreases as the campaign accumulates data.
For Facebook campaigns, underfunding the launch creates a specific problem: the platform's algorithm needs a minimum number of conversion events to optimize delivery. A daily budget that does not generate sufficient weekly conversions keeps the campaign in learning mode, where performance is inconsistent and the ad spend calculator outputs are less reliable than they would be after the learning phase completes.
Tracking marketing campaign profitability across both channels
Running Google Ads and Facebook simultaneously introduces an attribution question that affects how marketing campaign profitability is measured for each channel. A prospective customer might see a Facebook ad on Monday, search your business name on Google on Friday, and convert on a branded keyword. Last-click attribution credits the Google search entirely and records Facebook as contributing nothing to the sale.
When measuring digital advertising ROI across multiple channels, supplement last-click reports with assisted conversion data. The ad spend calculator for a multi-channel setup needs to account for overlap in customer journeys rather than treating each platform as a separate and self-contained funnel. Channel-level ROI is useful for budget allocation decisions; business-level ROI accounts for how both channels work together across the full purchase path.
Get a free digital advertising ROI analysis
Running this calculation before any campaign launches is the difference between validating a profitable channel and discovering a margin problem after the budget is spent. The required inputs are honest: website conversion rate data from your analytics, bid estimates from Google Keywords Planner or Facebook's audience tools, and a realistic sales close rate from your actual pipeline. With those figures, you can project whether a campaign will return a positive digital advertising ROI before committing any spend.
Webugol builds and manages paid campaigns for businesses that validate the unit economics of digital advertising before launch. To request a free analysis of your Google Ads or Facebook profitability, contact us.
Frequently asked questions
How do you calculate ROI for digital advertising?
Subtract total ad spend from campaign revenue, divide by ad spend, and multiply by 100. For a pre-launch estimate, multiply average cost per click by the inverse of your website conversion rate to find cost per lead, then apply your sales close rate to find cost per customer and compare that number against your average customer value.
What is a good ROI for Google Ads?
A positive return, meaning revenue exceeds total campaign cost, is the baseline threshold. Whether that return is adequate depends on customer lifetime value and margin structure. The pre-launch cost per conversion formula confirms whether the math supports entering the channel before any budget is committed.
How do you calculate cost per lead for Facebook ads?
Multiply your estimated cost per click for the target audience by the inverse of your Facebook landing page conversion rate. Define your audience segments first, use Facebook's planning tools to get a CPC estimate for that audience, then apply the typical conversion rate range of 1 in 30 to 1 in 50 to project your cost per lead.
What is the average Facebook Ads conversion rate?
Facebook and Instagram typically convert 1 in 30 to 1 in 50 clicks, roughly 2% to 3.3%. The rate is lower than Google Search because the audience was not actively searching for your offer. Ad creative quality is the primary lever, since higher CTR at a fixed CPM reduces your effective cost per click.
How much should you spend on digital advertising?
Divide your monthly customer target by your sales close rate to find required leads, then multiply by cost per lead to find your minimum budget. A budget below this floor cannot reach the customer target even when all conversion benchmarks perform as projected. Testing and optimization require spending above the minimum.