



Facebook ads CTR: benchmarks, what's good, and how to raise it
Facebook ads CTR (click-through rate) is the percentage of people who click your ad after seeing it. Across all industries, the average CTR for Facebook ads ranged from 0.89% in 2019 to 0.99% in 2020, then returned to 0.90% in 2021, based on benchmark data aggregated across 18 industries. Whether that figure counts as "good" for your account depends on your sector, your campaign objective, and what happens after the click. A high CTR combined with few conversions is a diagnostic signal, not a measure of campaign success.
What CTR measures and how to track it in Ads Manager
Click-through rate equals total clicks divided by total impressions, multiplied by 100. You do not need to calculate it by hand. Inside Facebook Ads Manager, the "Performance and Clicks" column preset displays CTR automatically alongside CPC and other key data. You can also build a custom column set that keeps CTR, frequency, and conversion metrics in one view for faster daily analysis.
Meta reports two distinct CTR variants:
- Link CTR: clicks on the ad's CTA button, headline, or destination URL only.
- All CTR: every click on the ad unit, including clicks on your Page name, profile photo, hashtags in your copy, or the "See more" expand text.
When advertisers compare results against facebook advertising benchmarks, they should use link CTR. All-clicks CTR inflates the number and makes external comparisons unreliable. Facebook ad link clicks are the metric most directly connected to website traffic, lead form submissions, and downstream revenue.
What is a good CTR for Facebook ads?
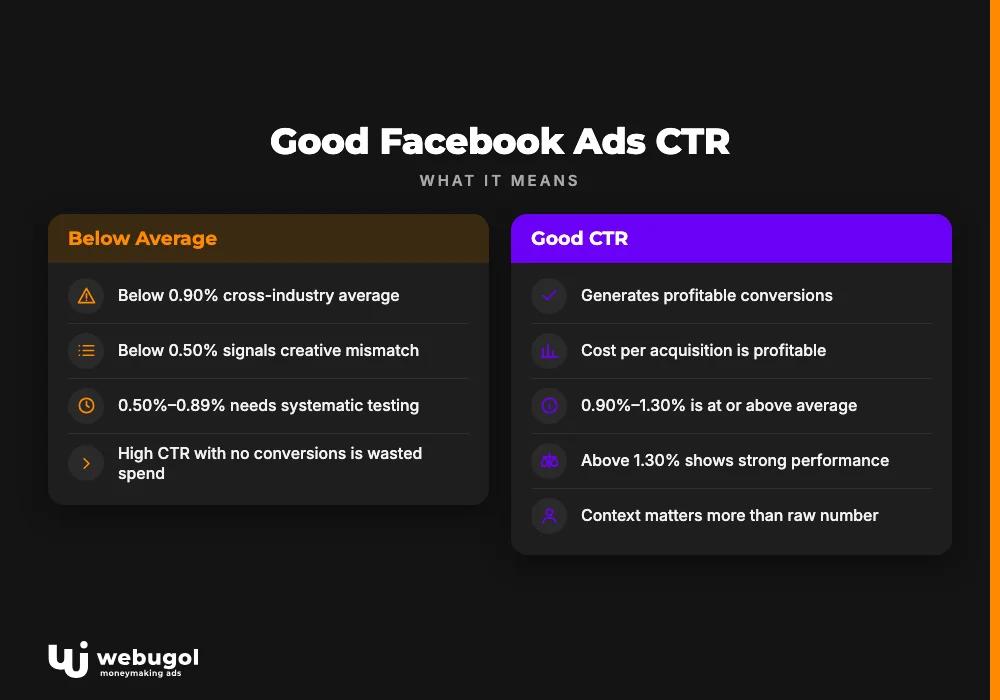
A CTR above the cross-industry average of 0.90% is above average in a statistical sense. In practice, what counts as a good CTR on Facebook means a rate that generates profitable conversions at a cost your margins can absorb. Context matters more than the raw number.
Consider a concrete scenario: 1,000 impressions at a 5% CTR produces 50 clicks. If those 50 visitors convert at a strong rate and cost per acquisition is profitable, that CTR is excellent. If they bounce immediately, the high CTR only increased your spend for no return. The click-through rate becomes meaningful only when read alongside post-click conversion data.
Facebook ads CTR benchmark ranges: what each level signals
| CTR range | What it typically signals |
|---|---|
| Below 0.50% | Likely a creative or audience mismatch; review both before spending more |
| 0.50%–0.89% | Below the cross-industry average; systematic testing recommended |
| 0.90%–1.30% | At or above the cross-industry average; validate with conversion data |
| Above 1.30% | Strong performance; confirm with Pixel data that clicks are converting |
Based on benchmark data, 2019–2021, across 18 industries.
These ranges are reference points, not hard rules. A 0.70% CTR in a high-ticket B2B service category can outperform a 2% CTR in a discount retail campaign when you measure ROAS instead of raw clicks.
Facebook ads CTR also shifts by campaign objective. Awareness campaigns typically show lower rates than conversion or lead gen campaigns because the audience has no purchase intent built in. Comparing CTR across different campaign types in the same account often produces misleading conclusions.
For a breakdown of how to structure ads that generate strong CTR from launch, the Webugol guide to building effective Facebook ads covers the creative and copy fundamentals that drive engagement.
What is the average Facebook ads CTR by industry?
Facebook advertising benchmarks across 18 industries show an average between 0.89% and 0.99% from 2019 to 2021. That aggregate number hides wide industry-level variation: some sectors consistently run more than double the overall mean.
The legal industry recorded the highest facebook ads ctr of any tracked category at 1.61%. Legal advertisers benefit from audiences actively searching for attorney representation, where the ad addresses a specific, high-stakes need. That intent-driven context produces higher click engagement than lifestyle or entertainment categories, where users scroll without a defined goal.
Across the 18 measured industries, performance variation can exceed 100% between the strongest and weakest sectors. An average CTR that looks competitive versus all industries may be underperforming for a naturally high-intent vertical. An advertiser at 0.80% might be outperforming the realistic ceiling for their specific category.
The practical implication: identify your industry's baseline before drawing conclusions from your account data. If that industry-specific number is unavailable, the cross-industry averages provide a rough orientation, but weight recent campaign history more heavily than historical benchmark figures.
High-intent verticals (legal, financial services, healthcare) tend to post stronger CTR than broad consumer goods because users scroll with a problem to solve rather than browsing passively. Running campaigns in an intent-rich category is a structural advantage for facebook ads ctr, not a disadvantage, even when CPCs in those sectors are higher.
What is the difference between link clicks and all clicks in Facebook Ads Manager?
Link clicks count only clicks that send users to your destination: the CTA button (such as "Shop Now," "Learn More," or "Get Quote"), a linked product image, or the headline. These are the only clicks that drive traffic to your landing page or lead form.
All clicks include link clicks plus every other interaction with the ad unit: visiting your Facebook Page by clicking the name or thumbnail in the ad header, expanding the post text, clicking a hashtag, or tapping a tagged user. None of those actions send anyone to your offer.
A campaign with a high all-clicks CTR and a low link CTR points to a specific diagnostic: users find the ad engaging in a passive way, but the CTA or offer fails to drive destination intent. That is a different problem than a campaign with uniformly low CTR across both measures.
In Ads Manager, "CTR (link click-through rate)" and "CTR (all)" are separate columns. When reporting the meta ads click-through rate or comparing against external facebook advertising benchmarks, always specify which figure you are using. Mixing the two in the same comparison leads to inaccurate conclusions and incorrect optimization decisions.

How does CTR affect Facebook ad costs?
CTR and CPC (cost per link click) are directly linked through Meta's auction system. When your ad earns a higher click-through rate relative to other ads targeting the same audience, the algorithm interprets it as more relevant and lowers your cost per click. Low facebook ads ctr increases CPC because the system deprioritizes ads that users ignore.
CPC is calculated as total spend divided by total link clicks. The relationship between CTR and CPC makes improving your click-through rate one of the most cost-efficient levers for reducing ad costs without cutting budget.
Two scenarios drawn from benchmark analysis illustrate this:
- Scenario A: CPC of $0.01, 10,000 clicks, $100 spent, $150 revenue.
- Scenario B: CPC of $1.00, 100 clicks, $100 spent, $250 revenue.
Both campaigns spend the same. Scenario B generates 67% more revenue from 1% of the clicks. This is the core reason that optimizing purely for high facebook ads ctr can be counterproductive: click volume and click quality are separate variables. A campaign with massive CTR and a poor audience match generates traffic that never converts, while a lower but well-targeted CTR can deliver profitable ROAS.
ROAS (return on ad spend) connects CTR and CPC to actual business results. Once you have enough conversion data by audience segment or creative variant, you can determine which CTR range is profitable for your specific margins.
Allocating your Facebook ad spend correctly from the start also protects CTR: under-funded campaigns cycling through narrow audiences accumulate frequency problems that push CTR down and CPC up before you have enough data to optimize.
How do I increase my Facebook ad CTR?
Improving Meta ads results, and knowing how to improve Meta ads results specifically for your account, requires identifying where CTR loss originates: the audience, the creative, the placement, or the offer itself. These are the levers with the most consistent impact.
Audit your audience before adjusting creative
A creative that performs at 2% CTR for the right audience will fall below 0.30% for the wrong one. Before making any creative changes, check whether your targeting parameters match the demographics, interests, and behaviors of your actual buyers. Facebook Pixel conversion data is the most reliable source for this validation.
For cold campaigns and lookalike audiences, avoid layering too many interest restrictions. Over-targeting shrinks your audience, raises frequency, and forces the algorithm to show your ad repeatedly to the same users, which accelerates CTR decline through overexposure.
Control frequency proactively
Frequency measures how often one person sees your ad in a given window. For cold campaigns and lookalike audiences, frequency above 2 to 3 times within seven days signals that your budget exceeds what your audience size can absorb. At that point, CTR begins declining because familiar users scroll past.
For retargeting campaigns, higher frequency is expected and productive up to a threshold. The acceptable range for retargeting sits between 3 and 5 impressions over seven days. Beyond that, additional impressions produce diminishing click returns and can create negative associations with your brand.
There are narrow exceptions. High-intent promotional windows like Black Friday, Cyber Monday, a major sale, or a new location opening can justify temporarily higher frequency because the offer is time-sensitive and the audience already has context for the urgency.
When frequency rises and facebook ads ctr drops at the same time, the diagnosis is almost always one of three things: audience saturation, creative fatigue, or a budget-to-audience-size mismatch. Reduce budget, refresh creative, or expand targeting.
Lead with video and front-load your message
Short video content outperforms static images across most placements based on current usage patterns. The first 3 to 4 seconds of a video are the critical window: users decide in that time whether to keep scrolling or engage. Lead with the most compelling element of your offer, a product in use, a problem your audience recognizes, or a direct statement of the benefit. Starting with a logo sequence or brand intro wastes the only seconds that matter for facebook ads ctr.
For static ads, the visual must communicate the offer at a glance. Copy should reinforce the image, not repeat it. Test one creative variable at a time so that when CTR shifts, you can attribute the change to a specific element.
Match your CTA to the funnel stage
Cold audiences discovering your brand respond better to low-commitment CTAs like "Learn More." Retargeting audiences who have already visited your site or engaged with your content respond better to "Shop Now," "Get a Quote," or "Book a Call." A CTA that asks for a level of commitment the user has not reached suppresses link CTR even when the creative itself is strong.
Use native lead forms as a fallback
When your website has conversion issues that have not yet been resolved, Facebook's native lead forms can capture interest without sending users off-platform. Lead form campaigns can deliver competitive CTR in some categories because the friction of leaving the app is removed.
The trade-off: lead quality from forms sometimes differs from landing page traffic. Confirm with your CRM or sales team that form leads convert downstream before scaling. Ensure ad copy accurately describes what users will find in the form. Ads that oversell the offer and underdeliver generate high CTR with leads that never become customers.

Why a high facebook ads ctr doesn't guarantee results
Most analyses of average CTR for Facebook ads stop at the click. The more useful question is what happens after the click, because strong CTR combined with low conversions points to a specific, diagnosable problem.
Validating CTR quality with Facebook Pixel
Facebook Pixel is a JavaScript code snippet installed on your website. When users click your ad and arrive on your site, Pixel tracks their behavior: page views, product views, add-to-cart events, purchases, and form submissions. That data appears in Ads Manager, where you can compare click volume against actual conversion events.
If facebook ads ctr looks strong but Pixel data shows few purchases or leads, one of three things is typically happening: the audience clicks from curiosity rather than intent, the ad misrepresents the offer, or the website fails to convert the traffic it receives.
When Pixel shows strong conversion rates from clicks, the situation reverses. Raising facebook ads ctr becomes a direct lever for revenue, and creative testing and audience expansion have a clear business case behind them.
Without Pixel tracking, you are measuring a KPI with no confirmed connection to business outcomes. The Meta Conversions API, the server-side version of Pixel, improves tracking accuracy in browsers that restrict cookies. Running both for the same campaigns gives you the most reliable conversion data.
When the website is the actual bottleneck
An ad running at 1.50% CTR can underperform financially if users land on a site that is slow, confusing, or poorly optimized for mobile. Common post-click failure points:
- Contact or purchase forms with too many required fields.
- Product pages missing clear pricing, imagery, or reviews.
- Mobile layouts that are difficult to navigate (most Meta ad traffic arrives on mobile).
- No obvious primary action for users to take after they land.
If you have tested multiple audiences and creatives and conversions remain flat, audit the landing page before adjusting anything at the ad level. The ad's job ends at the click. Converting that click is a website problem.
Running traffic to a Facebook lead form can serve as a bridge while a site rebuild is in progress. Monitor lead quality from those forms closely: high CTR into a form with poor downstream conversion usually means the targeting or the offer description needs adjustment. Ads that mislead the audience about what the form delivers produce a decline in lead quality that no CTR improvement can fix.
Companion metrics that sharpen CTR analysis
Tracking facebook ads ctr in isolation gives you an incomplete picture. These three metrics add the context that makes CTR data actionable.
Frequency and CTR move inversely
As frequency rises past 2 to 3 impressions per seven days on a cold campaign, CTR typically declines because users have already processed the creative and have no new reason to click. Monitoring both metrics together shows whether a CTR drop comes from audience saturation or a genuine creative problem.
High frequency on a small budget can be unavoidable in narrow targeting. In those cases, pacing impressions by limiting daily reach rather than total budget can distribute exposure more evenly across the week and delay CTR decline.
CPC as the financial output of CTR
CPC is the direct financial consequence of your click-through rate. When facebook ads ctr drops, CPC rises because each click requires more impressions to generate. Rising CPC with stable or declining CTR signals that your ad is losing relevance in the auction, whether because a competitor entered the same audience, creative fatigued, or seasonal CPCs across the platform increased.
Tracking CPC alongside CTR lets you calculate whether the cost per click is profitable given your average order value and conversion rate. That calculation tells you the CTR you need to sustain, not an industry benchmark.
Video average play time as a companion to link CTR
For video ads, average play time reveals whether users watch past the opening seconds. A high facebook ads ctr combined with very low average play time (under 3 seconds) often means users click from curiosity but lose interest quickly, which typically results in poor post-click conversion rates even when link clicks look healthy.
Ads Manager also shows the specific timestamp at which most users stop watching. That drop-off point identifies where the creative loses relevance. Moving the key message or the core offer to before that timestamp is one of the highest-leverage optimizations available for video campaigns, because it aligns the most important content with the window when users are most engaged.
Ready to improve your Meta ads performance?
The benchmarks and tactics in this article provide the framework for diagnosing and improving facebook ads ctr. Translating that framework into consistent results across different industries, objectives, and audience sizes requires ongoing testing and campaign-level analysis. The team at Webugol works with advertisers to identify CTR and conversion gaps, build audience strategies, and connect ad performance to revenue metrics. If your Meta Ads campaigns are underperforming, reach out to discuss what a structured improvement plan looks like for your account.
FAQ
What is a good CTR for Facebook ads?
The cross-industry average CTR for Facebook ads was 0.90% in 2021, 0.99% in 2020, and 0.89% in 2019, based on data across 18 industries. A CTR above 0.90% is above average, but whether it counts as "good" depends on your industry baseline, campaign objective, and whether post-click conversion rates support a profitable ROAS.
What is the highest CTR recorded in Facebook advertising benchmarks?
The legal industry posted the highest facebook ads ctr in multi-year benchmark data at 1.61%. Legal advertisers benefit from high-intent audiences actively searching for services, which drives stronger engagement compared to most consumer categories.
What is the difference between link clicks and all clicks in Facebook Ads Manager?
Link clicks count only the clicks that send users to your destination URL or lead form, making them the relevant metric for performance reporting and comparison against facebook advertising benchmarks. All clicks include every interaction with the ad unit, including Page name clicks and hashtag clicks, which do not drive any traffic to your site.
How does frequency affect facebook ads ctr?
When the same user sees your ad more than 2 to 3 times within seven days on a cold campaign, CTR typically begins declining because of ad fatigue. For retargeting campaigns, a frequency of 3 to 5 per seven-day window is generally acceptable before engagement drops off significantly.
Can a high CTR indicate a problem with my targeting?
Yes. A high CTR paired with low conversion rates often means your ad attracts clicks from users who are curious but not ready to buy, or who do not match your actual customer profile. Facebook Pixel conversion data is the clearest way to confirm whether the audience clicking your ads is converting at a rate that supports your campaign goals.