



Patient Lifetime Value: Formula, Benchmarks, and the 5 Levers That Actually Move It
Patient lifetime value (PLV) is the total net revenue a single patient generates across the full length of their relationship with your practice, calculated by multiplying average visit value by annual visit frequency by patient lifespan in years. This number sets the rational ceiling for what your practice can pay to acquire each new patient. Most practices set acquisition budgets without ever measuring it.
What is patient lifetime value in healthcare?
Patient lifetime value is the total net revenue a practice expects to earn from one patient over the entire course of that relationship. It is built from three inputs: average net revenue per visit, how many times a year that patient visits, and how many years they stay before churning.
Healthcare PLV differs from retail CLV in ways that matter operationally. HIPAA-compatible tracking requirements limit your ability to follow a patient from ad click to appointment to recognized revenue without purpose-built infrastructure. No-show rates and compliance constraints on retargeting add friction that retail businesses never encounter. When practice owners and marketing leads skip the PLV calculation entirely, acquisition budgets get set by gut feel, and those budgets are almost always wrong in one direction or the other.
How do you calculate the lifetime value of a patient?
For anyone asking "how to calculate the lifetime value of a patient," the answer begins with three inputs your billing and CRM systems already track.
The formula is:
PLV = Average Visit Value x Annual Visit Frequency x Patient Lifespan (years)
Each input requires a clean data source. Those sources typically live in separate systems that were never designed to connect. The sections below walk through each component and its most common measurement problem.
Step 1: Average visit value
Pull net collected revenue per visit from your billing or practice management system, not gross charges or estimated reimbursement. Net collected is what actually lands in your account after write-offs, insurance adjustments, and bad debt are removed.
Ancillary services and membership fees belong in this number. No-show forfeit fees do not, because they represent a visit that never happened. Practices that use gross charges overstate their PLV and set an acquisition budget ceiling their actual cash flow cannot support.
Step 2: Visit frequency
Calculate annual visit count per active patient from your CRM or PM system. The measurement trap here is no-show rate. An unmanaged no-show rate suppresses visit frequency silently, because absent visits accumulate as data gaps rather than explicit zeros. A practice with a 20% no-show rate is working with a visit frequency figure that understates real engagement, and every PLV calculation built from it is deflated by roughly the same margin.
Step 3: Patient lifespan from churn rate
Convert your monthly churn rate into an average patient lifespan: 1 divided by monthly churn rate equals average patient months; divide by 12 for years. A monthly churn rate of 2.5% produces an average patient lifespan of 40 months, or about 3.3 years.
Practices without a measured churn rate default to guessing 3 to 5 years. That assumption makes every downstream PLV figure unreliable regardless of how precise the other inputs are. Lifespan is the most volatile input in the formula, and it is the one most practices have never actually measured.
Worked example: From raw numbers to one figure
The following is an illustrative calculation. Replace these inputs with your own billing and CRM data to find your practice's actual figure.
Assume a telehealth practice: $240 average visit value, 2.8 visits per year, 3.6-year measured patient lifespan. PLV = $240 x 2.8 x 3.6 = $2,419.
Now adjust the inputs slightly: visit frequency drops to 2.2 and lifespan shrinks to 2.8 years. PLV falls to $1,478. That $941 gap per patient compounds across hundreds of acquisitions and changes what you can rationally spend on each one.
Patient lifetime value benchmarks by specialty
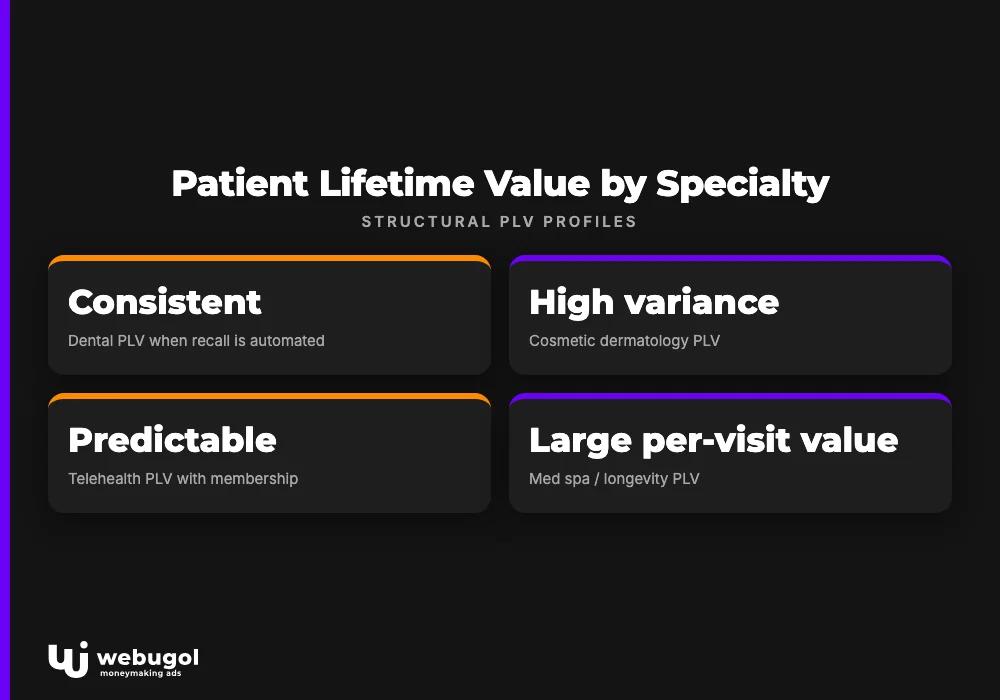
| Specialty | Avg visit value | Annual visit frequency | Avg patient lifespan | PLV profile |
|---|---|---|---|---|
| Dental (general) | Moderate | Predictable (2 hygiene visits/year baseline) | Long when recall is automated | Consistent; treatment acceptance rate is the main upside lever |
| Dermatology (cosmetic) | High | Moderate (repeat injectables and treatments) | Medium to long | High variance; cosmetic vs. medical patient mix determines the numerator |
| Telehealth / GLP-1 | Lower per-visit | High (subscription cadence) | Governed by 90-day early-churn window | Predictable with membership in place; early dropout is the primary risk |
| Med spa / longevity | High | Lower than primary care | Medium; extended by membership programs | Large per-visit value; continuity structure shifts revenue from volatile to recurring |
These are structural profiles based on typical business model characteristics. Use the formula above with your own billing data to produce a figure you can defend.
No competitor in this space publishes specialty-level PLV context. The profiles below describe the structural dynamics of each vertical so you can understand the average lifetime value of a patient in your specialty, not an industry average that blends incompatible business models.
Dental
The lifetime value of a dental patient in a general practice is among the most predictable in healthcare when recall flows are automated. Twice-yearly hygiene visits create a reliable frequency baseline, and treatment acceptance rate determines how far above that baseline average visit value climbs.
Orthodontic and cosmetic add-ons lift both visit value and total PLV substantially, but they introduce variability into the lifespan calculation: patients who complete a defined treatment course may not continue general care at the same practice. The practices with the highest dental PLV combine automated recall with an active strategy for converting hygiene-only patients into treatment-accepting ones.
Dermatology
Dermatology patient lifetime value diverges sharply based on patient mix. Medical dermatology tends toward episodic visits at lower frequency; cosmetic dermatology, where patients return for repeat injectables and skin treatments, produces higher per-visit value and more predictable visit cadence.
Running both populations through a single PLV calculation distorts both the numerator and the denominator. A practice with a mixed caseload will underestimate the economics of its cosmetic cohort and set the wrong acquisition budget for each service line. Segment the calculation before budgeting separately.
Telehealth and GLP-1 programs
Subscription-model telehealth produces a different PLV profile than fee-for-service care. Per-visit revenue is typically lower, but predictable monthly frequency driven by the subscription structure, rather than patient initiative, changes the overall math substantially.
For GLP-1 and TRT programs, the 90-day early-churn window is the dominant risk variable. Patients who exit before week 12 leave with a lifetime patient value close to zero, regardless of what the program charges per month. The economics depend almost entirely on getting patients through that first quarter with enough clinical progress and operational support to make renewal the obvious next step.
Med spa and longevity clinics
Med spa and longevity practices carry high per-visit revenue offset by lower visit frequency than primary care. The lever that moves PLV most in this vertical is membership: converting episodic patients into a committed continuity program extends patient lifespan and makes frequency predictable.
LifeRx MD, a med spa in the Webugol Healthcare Growth System program, achieved an 85% LTV increase after fixing retention and recall flows. The structural shift was not additional marketing spend. It was closing the gap between patients who intended to return and patients who had a confirmed next visit on the calendar.

Why most practices can't actually measure their own PLV
The problem is almost never the formula. It is the data. Five signs your patient lifetime value is an assumption rather than a measurement:
- Your billing, CRM, and PM systems have never been connected or audited end-to-end.
- You are using an estimated monthly churn rate, not one derived from cohort data.
- Your visit frequency data comes from scheduled appointments, not completed visits.
- You cannot identify which patients visited once and never came back.
- No-shows appear in your system as empty calendar slots, not as data points.
Without a working retention measurement layer, your PLV is an assumption. The patient retention measurement guide covers the data baseline your stack needs before these numbers become reliable.
Understanding where patients drop off in the first place requires visibility into the full patient path. The patient journey map shows how to identify the specific touchpoints where your practice is losing patients it should be keeping.
When your CRM can't track retention
Most healthcare CRMs are built for appointment scheduling, not cohort analysis. They store appointment history but do not flag gaps, calculate patient lifespan, or surface which patients are trending toward churn.
Retention tracking requires more than an appointment log. You need a definition of active versus lapsed, a mechanism to identify patients approaching that threshold, and a trigger that fires before they cross it. Most practice CRMs deliver the first element and nothing else.
How does no-show rate distort your PLV calculation?
A 20% no-show rate suppresses your recorded visit frequency by roughly 20% and deflates every PLV figure built from it. The distortion is invisible because no-shows appear as schedule gaps, not as negative data points.
HIPAA-compliant tracking tools that capture show rate at the patient level let you adjust the frequency input for actual visit behavior rather than scheduled intent. For practices with no-show rates above 10%, correcting this single input changes the PLV calculation enough to materially alter acquisition budget decisions.
How PLV changes the math on your max allowable CPA
Once you have a verified patient lifetime value, you have a rational ceiling for customer acquisition cost. The formula is:
Max CAC = PLV / Target Payback Window (months)
For a practice with a $1,800 PLV targeting a 90-day payback, the ceiling is $600 per acquired patient. That is a number you can bring into a budget conversation, a board review, or a media partner negotiation. It is not a gut-feel estimate.
The payback window you choose matters. A 60-day window is conservative: it limits your max CAC and protects cash flow in a practice with tight margins. A 90-day window lets you compete more aggressively for high-value patients in contested markets. Most healthcare practices in active growth phases operate in the 60-to-90-day range, and the right number reflects your actual cash cycle, not a standard borrowed from a different business model.
If you are consistently spending more per acquired patient than PLV divided by your payback window allows, you are building a structural cash flow problem with every new patient you acquire. The math is that direct.
Without a verified PLV, your CPA target is a guess. The Healthcare Growth System starts with a full tracking and funnel audit so your budget ceiling is built on real numbers, not assumptions. Book a Strategy Call.

5 operational levers that move patient lifetime value
Competitors in this space stop at "improve patient experience." Each lever below connects to the specific PLV input it affects, so you can see exactly which number moves when you pull it.
- Cut your no-show rate: targets visit frequency
- Speed-to-lead: targets visit frequency and patient lifespan
- Membership and continuity programs: targets visit frequency and patient lifespan
- Recall flows: targets patient lifespan
- Post-visit follow-up: targets visit frequency
Cut your no-show rate
Every no-show removes a completed visit from the frequency calculation and creates a disengagement gap that accelerates churn. The patient who misses once is statistically more likely to miss again, and each gap makes the next booking less certain.
For practices with no-show rates above 10%, HIPAA-compatible SMS confirmation sequences, deposit-backed booking, and day-before outreach deliver the highest return on implementation time. The question is not whether these interventions reduce no-shows. It is whether your current stack implements them in a form your compliance team has reviewed and approved.
Speed-to-lead
A new patient inquiry that goes unanswered for hours sets the visit frequency clock to zero before the relationship starts. The patient who never books a first visit has a patient lifetime value of exactly zero, regardless of how strong the clinical outcomes are downstream.
Speed-to-lead, measured in minutes rather than hours, is one of the KPIs most directly wired to PLV at the individual patient level. Treating it as a scheduling operations metric disconnected from marketing performance misses the actual cost of every hour it runs slow.
Membership and continuity programs
Subscription programs pre-commit patients to a fixed visit cadence. They convert variable frequency into predictable monthly recurring revenue and extend patient lifespan by removing the repeated decision to rebook.
For telehealth, GLP-1, TRT, and longevity practices, membership structure is typically the single highest-leverage driver of improving patient lifetime value. A patient on a committed membership does not churn in the same patterns as a fee-for-service patient. That structural difference shows up directly in the PLV calculation, and it compounds across the full patient base over time.
Recall flows
Automated recall sequences that reach patients before they lapse are a patient lifespan extension mechanism, not just a scheduling convenience. The difference between a patient who churned at month 8 and one who received a well-timed recall at week 6 is often a single message at the right moment.
For patients who have already crossed the lapse threshold, the approach changes: the patient win-back guide addresses the same underlying economics with different timing and messaging for an already-inactive population.
Post-visit follow-up
A follow-up message sent 24 to 48 hours after a visit closes the clinical loop and creates a low-friction path to the next booking. Practices that track rebooking rates from post-visit outreach consistently find that timing it within 48 hours outperforms cold recall.
Under HIPAA guidelines, follow-up communication must stay within the scope of the patient's consent. That constraint is a guardrail, not a barrier. A structured follow-up sequence that respects consent and stays within clinical scope is one of the lowest-cost retention investments a growing practice can make.
Where practices get patient lifetime value wrong
The five most common PLV mistakes that distort the number and lead to wrong budget decisions:
- Using gross charges instead of net collected revenue. Write-offs and insurance adjustments can reduce actual collected revenue substantially. Gross charges inflate PLV and produce an acquisition budget ceiling your cash flow cannot reach.
- Defaulting to a 5-year lifespan without measuring churn. A practice with a 4% monthly churn rate has an average patient lifespan of 25 months. That is meaningfully different from 60, and the gap changes every downstream budget decision that follows.
- Mixing new and established patient cohorts in one calculation. New patients have different visit frequency and churn profiles than patients in year three or four. Blending them creates a number that accurately describes neither group.
- Applying one formula across unlike specialties or service lines. A GLP-1 telehealth subscription patient and a cosmetic dermatology patient have fundamentally different PLV structures. A single practice-wide average obscures which service lines are profitable at current acquisition costs.
- Projecting PLV from hoped-for retention rates rather than measured ones. The number must come from what your patient base actually does, not from the improvement you expect once the retention initiatives you are planning are running.

Know your number before you scale your spend
Most practices discover theirs is lower than expected, or simply unmeasurable, the first time they run this exercise. Both outcomes are useful.
Low PLV identifies the lever to pull. Unmeasurable PLV identifies the tracking gap to close. Either way, the exercise clarifies the next decision. A verified patient lifetime value is the minimum required to set a defensible acquisition budget, hold a media partner accountable to real economics, or make a confident scaling call.
The Healthcare Growth System starts with a full tracking and funnel audit designed to produce a real PLV before any spend scales. If your current number is an estimate, that is where to start. Book a Strategy Call to find out where your numbers stand.
FAQ
What is patient lifetime value in healthcare?
Patient lifetime value (PLV) is the total net revenue a practice expects to earn from one patient across the full length of their relationship. It is calculated by multiplying average visit value by annual visit frequency by average patient lifespan in years.
How do you calculate the lifetime value of a patient?
Multiply three inputs: average net collected revenue per visit, annual visit frequency, and average patient lifespan. Derive lifespan from your churn rate: 1 divided by monthly churn rate gives average months; divide by 12 for years. Without a measured churn rate, any PLV figure is an estimate.
What is a good patient lifetime value for a medical practice?
There is no universal benchmark because patient lifetime value varies sharply by specialty, visit cadence, and service mix. A telehealth GLP-1 subscription program has a fundamentally different PLV profile than a general dental practice. The benchmarks section above provides structural ranges by specialty as a starting comparison point.
How does no-show rate affect patient lifetime value?
No-shows reduce your recorded visit frequency, which deflates your PLV calculation directly. A 20% no-show rate understates visit frequency across your entire patient base and causes you to underestimate patient value in every budget decision that follows.
Do membership programs increase patient lifetime value?
Membership programs increase PLV by converting variable visit frequency into a committed recurring cadence, which extends patient lifespan and makes frequency predictable. For practices running subscription-based programs such as GLP-1, TRT, or longevity protocols, membership structure is typically the single largest driver of PLV improvement.