



Executive marketing dashboard: what healthcare CEOs and CMOs actually need to see
An executive marketing dashboard is only useful when it tracks the full path from ad click to recognized revenue. In most healthcare practices, it does not. Platform metrics double-count the same patient across channels, while no-shows, refunds, and renewals remain invisible. This article explains what causes the gap and where to start fixing it.
What is an executive marketing dashboard?
An executive marketing dashboard is a board-level reporting view designed to answer causal revenue questions, not channel activity metrics. It tells you which spend drove recognized revenue and where the funnel broke, not how many people clicked an ad last Tuesday.
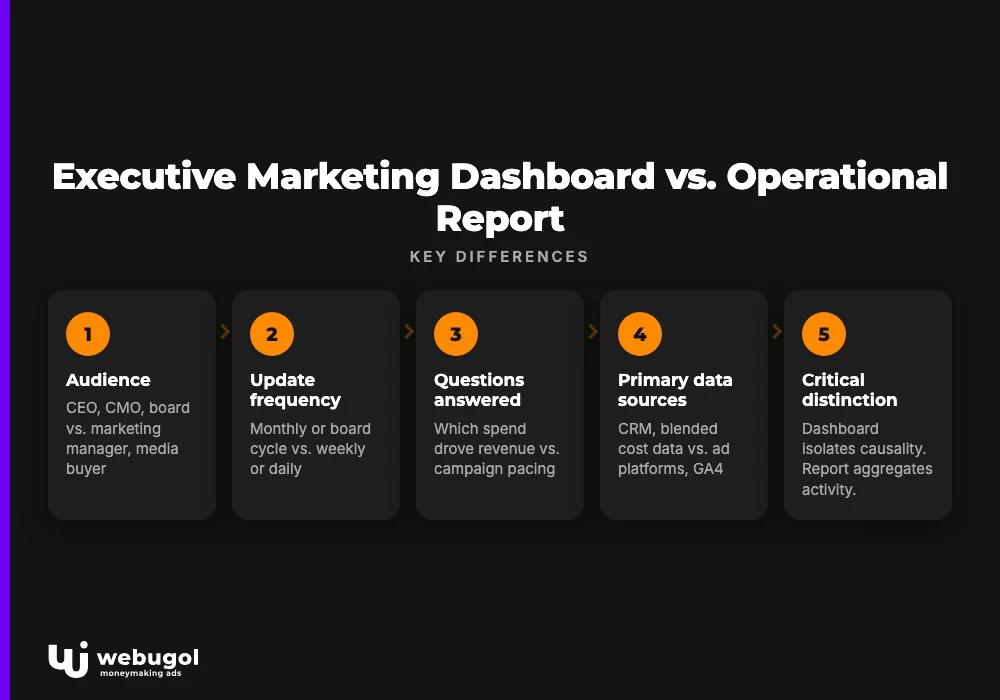
The difference from an operational marketing report comes down to audience and purpose. A marketing manager refreshes an operational report weekly to adjust campaign spend. A CEO or CMO reviews an executive dashboard monthly to decide whether the structure of the acquisition system is working.
| Executive dashboard | Operational marketing report | |
|---|---|---|
| Audience | CEO, CMO, board | Marketing manager, media buyer |
| Update frequency | Monthly / board cycle | Weekly or daily |
| Questions it answers | Which spend drove recognized revenue? Where does the funnel break? Is payback on track? | Which campaigns are pacing? Where did CPL move? What is today's volume? |
| Primary data sources | CRM (revenue-authoritative), blended cost data, show/close rates | Ad platform exports, GA4, channel dashboards |
The critical distinction: an operational report aggregates activity. An executive marketing performance dashboard isolates causality. When those two views are conflated into one report, executives get more data and less insight.
Why does your dashboard look fine while revenue stagnates?
The dashboard is green because every ad platform reports the revenue it wants to claim. Google says it drove the conversion. Meta says it drove the same conversion. GA4 records a session that touched both. The CRM records one booked appointment. Platform-attributed revenue is not a measure of real revenue; it is a sum of every platform's self-reported credit for the same patient.
This is not a configuration error. It is the structural default of any multi-platform setup. Each channel measures success by its own attribution window, and those windows overlap by design.
Three additional categories quietly disappear from most dashboards:
- No-shows. A booked appointment attributed as a conversion never completes. The acquisition cost stays; the revenue never arrives.
- Refunds and cancellations. Processed in billing, invisible in ad platform data.
- Renewals and continuity revenue. Membership and subscription renewals often route through a disconnected billing system, a gap that erodes long-term patient retention without appearing in any marketing report.
The result: a practice with a $40 cost per booked appointment might have a $140 cost per patient who actually pays and stays. The dashboard shows the first number. The bank account reflects the second.
If your practice is approaching a funding round or acquisition, this gap becomes a material risk. External auditors do not trust platform-attributed revenue figures; they reconcile back to the CRM and billing system.
The diagnostic Webugol runs first with every new healthcare client is exactly this reconciliation: comparing what the platforms claim against what the CRM and billing system actually show, because that gap tells you more about the state of your acquisition system than any single channel metric does.

What KPIs should an executive marketing dashboard include?
An executive marketing dashboard must track each stage of the revenue path from first click to recognized payment, not a combined conversion count. Collapsing the full funnel into a single conversion event makes it structurally impossible to locate where revenue leaks without a manual audit.
Revenue path visibility: click to booked to showed to paid
Each handoff must appear as a distinct tracked event: click, booked appointment, confirmed show, completed payment. When these stages merge into one "conversion," a 20% drop in revenue could be a lead volume problem, a show rate problem, a close rate problem, or a billing issue. You cannot locate the break without separating the stages.
Healthcare practices typically see the greatest revenue leakage between the booked appointment and the confirmed show. That gap is almost never visible in a marketing executive dashboard built from ad platform exports alone.
Speed-to-lead and show rate: the handoff metrics nobody owns
Speed-to-lead is the time between a patient submitting an inquiry and receiving a first contact. Show rate is the percentage of booked appointments that actually complete. Both metrics directly determine the real cost per acquired patient.
Both also sit in the gap between marketing and intake operations. Speed-to-lead lives in the CRM. Show rate lives in the scheduling system. Neither belongs to marketing, so neither gets owned. The fix is straightforward: pull both from the CRM into the reporting layer with a named owner for each metric.
CAC and payback window, not abstract LTV
Healthcare operators make budget decisions against a 60-to-90-day payback window, not a lifetime value projection that few practices ever verify against actual retention data. A CFO reviewing your board presentation will trust a 90-day CAC calculation before they trust an LTV model.
CAC calculated from ad platform data alone understates the real number because it ignores show rate and refunds. The correct CAC denominates cost against patients who completed and paid, not patients who booked. Once you remove the patients who no-showed or canceled, the acquisition cost can look materially worse than the platform reports. For how correct CAC connects to measuring actual returns across your full acquisition funnel, the reconciliation always starts at the revenue-authoritative source.

Why do my dashboard numbers not match my CRM?
Ad platforms, GA4, and your CRM use different attribution windows, and each claims the same patient independently, so three-way disagreement is not a technical error. It is the default state of any multi-platform setup. The platforms are not wrong within their own logic; they simply define conversion differently.
The practical fix is to designate one revenue-authoritative source and treat all others as directional signals. For healthcare practices, that source is the CRM, specifically the stage at which a patient completes payment rather than books an appointment. Every other system then reports toward that denominator, not independently of it.
Tracking configuration amplifies the disagreement. When conversion events fire inconsistently, missing UTM parameters leave sessions unattributed, or offline conversion imports lag by days, the gap between platforms widens further. Understanding why three platforms report three different numbers starts with the tracking layer, not the attribution model.
Webugol approaches this as a diagnostic problem rather than a reporting one. A 30-to-40% gap between platform-reported and CRM-recorded revenue is a consistent pattern across telehealth practices. In most cases it traces to a tracking break rather than just a window mismatch, and fixing that break is the prerequisite before any attribution model discussion has real meaning.

What to include in an executive marketing dashboard (healthcare edition)
Healthcare practices face reporting constraints that no generic dashboard guide addresses. HIPAA limits what can be tracked at the pixel level. Platform policies restrict health-condition targeting and retargeting. A compliance approver sits in the chain before anything ships.
The executive dashboard for a healthcare operator is not a filtered version of a standard marketing dashboard. It needs an accountability structure covering both compliance at the tracking layer and cross-vendor ownership of funnel outcomes.
How do you make an executive marketing dashboard HIPAA-compliant?
HIPAA-compliant dashboard tracking uses server-side conversion events and hashed identifiers rather than pixel-based tracking of medical conditions or treatment intent. Consent mode must be active across all ad platforms, and medical condition signals must be excluded from retargeting audiences.
The compliance approver needs to sign off on the tracking configuration itself, not only the ad creative or landing page copy. A setup where a pixel fires on a "schedule consultation for GLP-1" page without server-side safeguards creates exposure whether or not anyone inside the organization notices. Building compliance review into the reporting workflow prevents retroactive fixes that shut down campaigns mid-flight.
Cross-vendor accountability layer
When three vendors each own a slice of the funnel and none owns the revenue outcome, the executive dashboard becomes a negotiation tool rather than a source of truth. Each vendor reports against the metrics their slice produces; none accounts for what happens at the handoffs between scopes.
The dashboard needs to make handoff failures visible at the CEO level. Speed-to-lead assigned to intake operations, show rate assigned to the scheduling team, and close rate assigned to the consultation team must each appear as named-owner metrics in the board-level view. These should not live in separate vendor reports that never reach the executive layer.
Board-ready vs. weekly operational view
The monthly executive summary a CEO reviews before a board presentation and the weekly view a Head of Marketing uses to adjust campaigns must be separate outputs, even when they draw from the same underlying data. A weekly report built for campaign decisions is too granular for the board. A monthly executive view is too slow for daily optimization.
Conflating the two forces executives to scroll through campaign-level detail to find the revenue trend, while forcing marketing managers to defend strategic budget decisions in a tactical review format. Separating them is not an extra build; it is a different filter and aggregation layer on the same data.
How to build an executive marketing dashboard in 4 steps
Step 1: Name the revenue-authoritative source and audit it. Designate one system, typically the CRM at the payment-completed stage, as the source that defines actual revenue. Audit it for completeness: are no-shows recorded, are refunds logged, are renewals tracked within the same pipeline or in a disconnected billing system? Missing stages at this step produce a dashboard that is structurally incomplete before the first metric is added.
Step 2: Map every handoff stage as a separate conversion event. Document each step from click to payment as a distinct event: lead submitted, appointment booked, appointment confirmed, appointment completed, payment processed. Each event needs a data source, a tracking method, and a named owner. This mapping is where most practices discover that two or three stages have no owner at all.
If your current tracking setup has never been audited end-to-end, the full revenue-path audit program starts with exactly this mapping in Week 1.
Step 3: Connect cross-vendor data into one reporting layer. Each vendor's performance data needs to feed a single layer with one agreed definition per metric. Cost per booked appointment must mean the same thing whether the number comes from Google, Meta, or an affiliate network. When each vendor reports it differently, comparing spend efficiency across channels requires a manual reconciliation every single time.
Step 4: Assign a named owner for each metric and set a fixed review cadence. An executive dashboard without named owners is an observation tool. With named owners and a fixed monthly or board-cycle cadence, it becomes an accountability tool. The most common failure here is treating the dashboard as a reporting artifact rather than a decision-forcing mechanism: metrics update, nobody is accountable for acting on them, and the dashboard becomes wallpaper.
Ready to see what your executive marketing dashboard is hiding?
If your executive marketing dashboard shows strong performance but revenue growth has stalled, the gap is almost always structural: platform-attributed conversions that count the same patient multiple times, show rates that belong to no one in the reporting chain, and renewal or refund data that never enters the dashboard at all.
Webugol builds and owns the full path from ad click to recognized revenue, including the tracking layer, funnel, website, and reporting structure that makes handoff failures visible at the board level. The Healthcare Growth System starts with a full revenue-path audit in Week 1 so your dashboard reflects what the bank account actually shows. Book a strategy call to start there: /programs/healthcare-growth-system.
FAQ
What KPIs should an executive marketing dashboard include?
An executive marketing dashboard should track the full revenue path: cost per booked appointment, show rate, close rate, CAC, and 60-to-90-day payback window. Platform-level metrics like impressions and click volume belong in the operational report, not the board-level view.
What is the difference between an executive dashboard and a regular marketing report?
A regular marketing report shows channel activity by platform. An executive dashboard answers causal revenue questions: which spend drove recognized revenue, where the funnel breaks, and whether the payback window is on track. The two differ in audience, update frequency, and the data sources they draw from.
Why do my dashboard numbers not match my CRM?
Each ad platform, GA4, and your CRM uses a different attribution model and a different conversion window, so all three claim the same patient independently. The fix is to designate one revenue-authoritative source, typically the CRM, and treat platform numbers as directional signals rather than final revenue counts.
How do you make an executive marketing dashboard HIPAA-compliant?
Replace pixel-based tracking of health conditions with server-side conversion events and hashed customer identifiers. Apply consent mode across all ad platforms and exclude medical condition signals from retargeting audiences. Have the compliance approver review the tracking configuration, not just the ad creative, before any campaign goes live.
What should an executive marketing dashboard look like?
An executive dashboard should fit on one screen, update on a fixed cadence, and answer three questions without a guided walkthrough: is revenue on track, where is the funnel breaking, and which channel is producing payback-window-positive patients. If it requires explanation to read, it is an operational report.

