



Healthcare marketing KPI report: what your leadership team actually needs to see
A healthcare marketing KPI report is a structured summary of the metrics that measure whether marketing spend is driving patient acquisition and revenue outcomes, delivered to a defined audience at a set cadence. Most reports answer "how much" with precision. Almost none answer "why." For a practice owner or CMO running a $20,000-plus monthly ad budget, that gap has real costs: a board target gets missed, a tracking break goes undiagnosed for weeks, and leadership ends up with three conflicting numbers from three platforms. What you stop losing when you fix this is not just clarity; it is the trust that keeps budget approved and strategy intact.
What KPIs should a healthcare marketing report include?
A healthcare marketing KPI report needs metrics across four layers: acquisition, pipeline, revenue, and compliance-adjusted tracking. Generic reporting platforms cover the first layer. The other three are what separate a management tool from a metrics transcript.
| KPI | What it measures | Healthcare application | Primary data source |
|---|---|---|---|
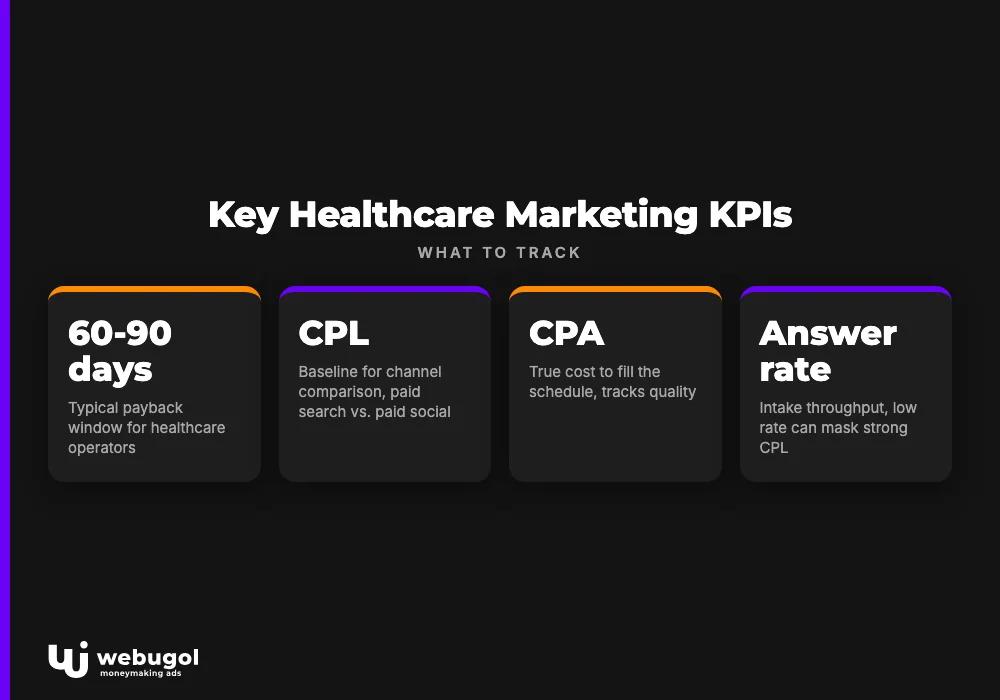
| CPL (cost per lead) | Ad spend divided by leads generated | Baseline for channel comparison; set separately for paid search and paid social | Ad platform + CRM |
| CPA (cost per acquisition) | Ad spend divided by booked consults or appointments | True cost to fill the schedule; tracks quality, not just volume | Ad platform + booking system |
| MER (marketing efficiency ratio) | Total revenue divided by total ad spend | Portfolio-level view when last-click attribution is unavailable | Finance + ad platform |
| Speed-to-lead | Time from form submit to first contact attempt | Healthcare leads have a narrow response window; delays inflate CPA | CRM / call tracking |
| Answer rate | Calls answered divided by calls received | Intake throughput; a low answer rate can mask strong CPL | Call tracking |
| Show rate | Consults attended divided by consults booked | Revenue conversion gate; belongs in marketing reporting, not just ops | CRM / booking system |
| CAC (customer acquisition cost) | Total marketing and sales spend divided by new patients or members | True acquisition cost across the full pipeline | Finance + CRM |
| Payback window | Months to recover CAC from revenue | Healthcare operators optimize to 60-90 days, not an abstract LTV | Finance + billing |
| Membership LTV | Revenue per member over the subscription lifecycle | Denominator for sustainable CAC calculations | Billing + CRM |
| Consent-adjusted conversion rate | Conversions tracked under consent mode divided by modeled total | Measures signal loss from HIPAA-compliant consent configuration | GA4 + server-side layer |
Acquisition KPIs: CPL, CPA, and MER
CPL, CPA, and MER form the acquisition layer of any healthcare marketing KPI report. They measure different things. CPL measures volume and channel efficiency. CPA measures quality-adjusted cost: a low CPL from a channel generating unqualified leads shows up as a high CPA when you trace leads through to booked consults. MER smooths over attribution noise that consent mode and HIPAA restrictions introduce by measuring total revenue output against total marketing spend.
Reading all three together catches the failure mode where CPA looks acceptable but masks a broken pipeline stage. If CPL is flat, MER is declining, and CPA is rising simultaneously, the problem is not the ad. It is the conversion from lead to booked consult, and no campaign optimization will fix it.
Pipeline KPIs: speed-to-lead, answer rate, and show rate
These three metrics live in the gap between marketing and operations. In most healthcare practices, no one in marketing owns them. That gap is often the real reason CPL tracking healthcare looks fine while CPA keeps climbing.
In healthcare, contact rates drop significantly within the first hour of inquiry. A patient searching for a GLP-1 program or men's health consultation is in a narrow decision window. Marketing teams that attribute high CPA entirely to ad platform performance often find the actual constraint is an answer rate below the operational threshold needed to convert the leads they are already generating.
Show rate is the downstream metric most marketing reporting frameworks miss. It belongs in the report because it determines whether a booked consult converts to revenue. Strong CPL and CPA numbers alongside a declining show rate means marketing is reporting success while revenue is flat. That is a reporting failure, not a performance failure.
Revenue KPIs: CAC, payback window, and membership LTV
Healthcare operators running membership or subscription programs optimize to a 60-to-90-day payback window. The operational question is whether a new member pays back their acquisition cost before the first renewal decision. Tracking CAC alongside payback window is what allows marketing to defend a CPL increase to the board when the offer economics justify it.
Membership LTV sets the ceiling for sustainable CAC. A practice generating substantial first-90-day revenue per member can sustain a meaningfully higher acquisition cost than a practice running a one-time service model. How membership programs compound LTV through renewal rates is where the payback model either works or breaks for most subscription health businesses.
Compliance-adjusted tracking: what HIPAA changes about measurement
Standard marketing attribution does not transfer to healthcare advertising without modification. HIPAA prohibits sending protected health information to ad platforms, making standard pixel tracking on condition-specific landing pages a compliance risk. Consent mode reduces the signal volume available to GA4 and ad platforms.
These constraints do not eliminate measurement. They change which signals are available and how to report them honestly:
- Track server-side event count versus client-side event count. The gap is your consent signal loss estimate.
- Report modeled conversion volume from GA4 alongside CRM-confirmed lead count.
- Use MER as the portfolio-level sanity check when last-click attribution is structurally unavailable.
What your current analytics setup actually exposes under HIPAA enforcement shapes which of these signals you can legally use, and which require server-side alternatives.
What vanity metrics should healthcare marketers remove from reports?
A metric that cannot drive a decision is administrative overhead. Remove these from any healthcare marketing KPI report:
- Remove raw website sessions without segmentation by traffic source or intent layer. Replace with sessions by channel filtered to high-intent landing pages.
- Drop social media impressions without a click-through rate tied to conversion. Replace with paid social CPL by audience and creative.
- Remove follower count across any platform. Replace with lead volume generated from organic social traffic.
- Drop email open rate as a primary success metric. Apple Mail Privacy Protection inflated open rates past usefulness. Replace with click rate and downstream conversion.
- Remove average session duration as a proxy for content quality. Replace with scroll depth on conversion pages and form start rate.
- Drop bounce rate as a standalone metric. Replace with exit rate on conversion pages and heat-map data for where users stop.
- Remove cost per click without downstream conversion data. CPC is a bidding metric. Replace with CPL and CPA per channel.
Each cut removes noise from the report. Each replacement forces accountability to a metric with a direct line to revenue.
How should you structure a marketing KPI report for executives?
Structure your healthcare marketing KPI report to match the audience: weekly for the team, monthly for the CMO, quarterly for the board. The KPI reporting cadence matters as much as the metrics inside each report. Same data set, three different questions, three different formats, three different stakes when wrong.
Weekly operational report
The weekly report is an operational tool. Its job is to surface what moved, flag what needs attention today, and create a shared view across the marketing team and intake staff. Format: a table or simple dashboard view, scannable in under three minutes.
What belongs in the weekly report:
- CPL by channel for the past seven days versus the prior week.
- Ad spend pacing against monthly budget.
- Speed-to-lead average for the week.
- Answer rate by day of week.
- Show rate for consults scheduled from last week's leads.
- Any anomalies in GA4 event counts or server-side tracking logs.
Monthly executive summary
The monthly report is where causality matters most. A CMO or practice owner reading this will get asked "why" in the next leadership meeting. The marketing report leadership sees must answer that question before it gets asked.
Structure the monthly executive summary in this order:
- Revenue attributed to marketing for the month, with attribution method noted.
- CAC and payback window trended over three months.
- Pipeline metrics: CPL, show rate, and consult-to-start conversion.
- Channel performance with spend and CPA per channel.
- Narrative explaining any metric that moved more than 15%, with a named cause from the four-suspect framework below.
A live healthcare CMO dashboard that surfaces these metrics in real time keeps the monthly summary from becoming the only moment leadership sees the numbers. It also solves the version-control problem: multiple stakeholders pulling different exports and arriving at a leadership meeting with incompatible figures.
Quarterly board report
A board report is not a compressed monthly report. Boards and investors ask structural questions the standard KPI summary does not answer: is the business improving its ability to acquire patients profitably over time?
A board-ready format for a healthcare company under investor or compliance scrutiny:
- CAC trend over six to twelve months.
- Payback window against membership LTV trend.
- MER on a rolling basis.
- Marketing-attributed revenue as a percentage of total revenue.
- Compliance posture: tracking configuration, platform policy review status, and any active flags.
Boards read structural health, not campaign details. The quarterly format exists to answer strategic questions, not to compress monthly campaign metrics into a shorter document.
Why do ad platform and Google Analytics show different numbers?
Ad platform, GA4, and CRM numbers never match exactly. In healthcare they diverge more than in other verticals. The GA4 CRM discrepancy is structural and predictable, and it is the most common reason a practice owner arrives at a leadership meeting with three contradictory figures and no way to know which one to believe.
Each platform counts a different thing by design:
- Ad platform counts clicks and attributes conversions by its own last-click or data-driven model, within the signal window the platform can observe.
- GA4 counts sessions and events filtered by consent mode. In healthcare, signal loss is significant because health-condition pages typically require explicit consent before analytics tags fire.
- CRM counts leads that entered the pipeline after deduplication. Duplicate form submissions, test leads, and leads matched to existing contacts are excluded before the CRM count is generated.
Attribution model differences add a second layer. A seven-day click, one-day view attribution window in a paid social platform counts differently from a GA4 session-based model that only credits the last traffic source before conversion. These are not errors. They are different measurement choices producing systematically different numbers.
The goal is not perfect agreement between platforms. It is a known, stable difference you can explain to a CFO in a single sentence. That stability is what makes healthcare marketing attribution defensible under scrutiny, and what makes your healthcare marketing KPI report a management tool rather than a source of debate.
How do you diagnose a metric drop in healthcare marketing?
When a metric moves in your healthcare marketing KPI report, four suspects explain almost every case: a market shift, an account change, a tracking break, or a site deploy. The diagnostic process is about ruling out each suspect in order, with evidence, before drawing a conclusion.
Suspect 1: market shift. A market shift shows up across all channels simultaneously and cannot be reversed by any change inside the account. Evidence: Google Trends shows declining search volume for core category terms; auction insights show new or more aggressive competitors entering the market; CPL rises in both Google and Meta simultaneously and proportionally. Document it with supporting data. Do not burn optimization budget trying to reverse an external macro condition.
Suspect 2: account change. An account change affects one platform or one campaign without touching others. Check the ad platform change log for bid strategy updates, audience edits, or budget reallocations in the 72 hours before the metric moved. Verify that campaign structure changes did not reset the algorithm's learning period. If the change log is clean and the metric still moved, rule out Suspect 2.
Suspect 3: tracking break. A tracking break produces a sudden change in reported volume that does not match actual business activity. Evidence pattern: GA4 real-time event counts diverge from historical averages with no corresponding change in actual traffic; server-side and client-side event counts diverge beyond the typical consent-mode gap; CRM lead volume holds steady while GA4 conversion events drop. In healthcare specifically, a consent management platform update that silently changed the consent mode configuration is a common and hard-to-detect cause. Fast detection is both a measurement requirement and a compliance one: a misconfigured tag that fires protected health information to an ad platform creates exposure.
Suspect 4: site deploy. A site deploy that changes the conversion path, page load time, or form behavior can move every downstream metric overnight. Compare the deploy log timestamp against the metric change timestamp. Check Core Web Vitals before and after the deploy date; a CLS or LCP regression on the booking page will reduce conversion rate without touching the ad account.
Ruling out Suspect 4 requires direct coordination with whoever manages the deployment pipeline. In practices where marketing and development operate in separate lanes, this is often the last conversation that happens. It should be the first.
Build a KPI report that answers "why"
If your healthcare marketing KPI report shows the numbers but cannot explain what drove them, the problem is not the report format. It is a tracking and attribution gap upstream. The same gap that makes your report untrustworthy is the gap that makes the board ask which number to believe.
Webugol works with healthcare operators as the accountable owner of the full revenue path from ad click to recognized revenue. What operators stop losing is diagnostic uncertainty: when a metric moves in the report, the cause gets named before the leadership meeting, not after.
The Healthcare Growth System starts with a reporting-layer diagnostic: mapping what your current stack can and cannot answer, and what it would take to close the gap. Book a strategy call to see what a diagnosis-first reporting system looks like for your practice.
FAQ
What KPIs should a healthcare marketing report include?
A healthcare marketing KPI report must cover acquisition KPIs (CPL, CPA, MER), pipeline KPIs (speed-to-lead, answer rate, show rate), and revenue KPIs (CAC, payback window, membership LTV). Compliance-aware tracking configuration determines which of these signals are available without violating HIPAA consent requirements.
Why do ad platform and Google Analytics show different numbers?
Each platform counts differently: the ad platform counts clicks and attributed conversions by its own model; GA4 counts sessions and events filtered by consent mode; the CRM counts leads after deduplication. Attribution model differences, consent signal loss, and deduplication rules each produce a systematic gap. The goal is not perfect agreement but a known, stable difference you can explain to leadership.
How should you structure a marketing KPI report for executives?
Weekly reports cover operational metrics for the internal team. Monthly executive summaries lead with revenue, then CAC and payback window, then pipeline metrics with a narrative on any metric that moved more than 15%. Quarterly board reports address structural performance, compliance posture, and long-term trend data, not campaign-level details.
What vanity metrics should healthcare marketers remove from reports?
Remove raw website sessions without segmentation, social media impressions without conversion data, follower count, email open rate, average session duration, bounce rate as a standalone metric, and cost per click without downstream conversion data. Replace each with the nearest metric that has a direct line to booked appointments or revenue.
How do you diagnose a metric drop in healthcare marketing?
Apply the four-suspect framework in order: market shift (affects all channels simultaneously), account change (affects one platform), tracking break (reported volume diverges from actual business activity), and site deploy (timestamp correlates with the metric change). Ruling out each suspect with evidence prevents misattributing a tracking issue to ad performance, or a site deploy to a market condition.

